Applying Interpolation
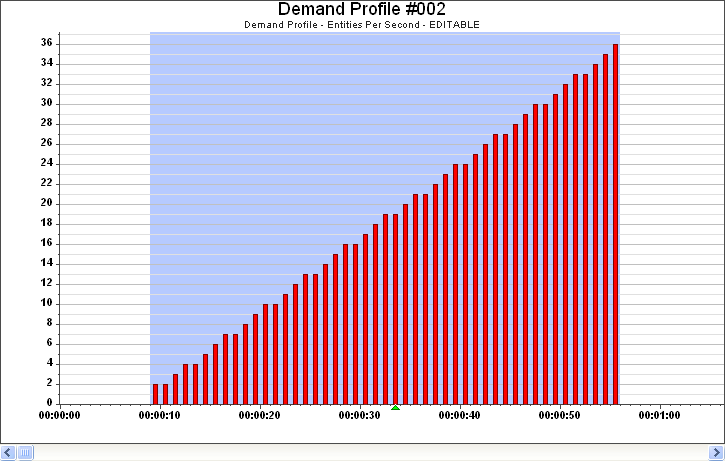
The Interpolation function takes the demand values at the start and end of a selected data range and generates demand data by interpolating values linearly from the first value in the data range to the last.
You can use interpolation to quickly fill-in sections of the demand graph with equal values or to generate linearly increasing or decreasing demand between two different values.
The following procedure assumes that you have already selected a Data Profile.
To apply Interpolation:
-
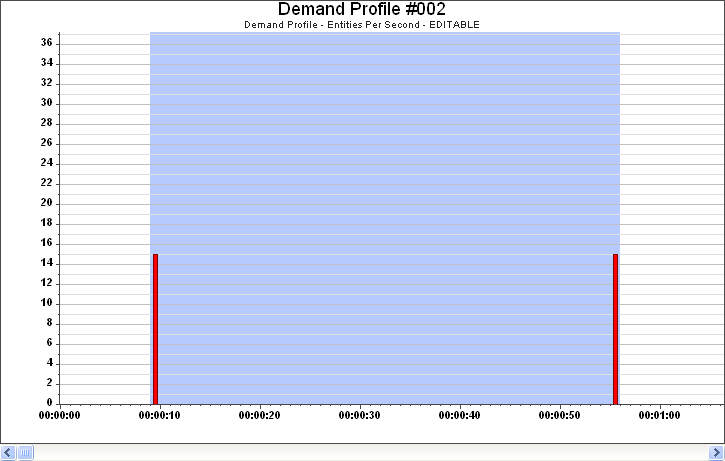
Select the range of data over which you want to apply the
interpolation, including the first and last values which define the
interpolation.
Select the first and last data values very carefully to avoid unexpected results.
-
Right-click in the graph and select
.
The interpolation is performed and the results displayed in the graph.
The following examples illustrate the Interpolation function. The selected demand data is illustrated in the left-hand graphs with the results of the Interpolation illustrated in the right-hand graphs.


Select the Interpolation range carefully. If you accidentally select zero as the first or last values, the result will be inaccurate.